
Seasonal selling by numbers
A full year of veg box demand, week by week
Veg box demand follows an annual cycle. To map it precisely, we analysed every completed, paid order placed across our twenty largest box schemes through the whole of 2025 - schemes that traded the entire year, so each contributes a full twelve months. To compare schemes of different sizes on equal terms, each scheme's own average week is set to 100.
We show this weekly rather than monthly on purpose. Monthly totals are distorted by the calendar: Sunday is by far the biggest order day (around 78,500 orders across the sample, versus about 66,000 on the next-busiest day), so a month with five Sundays - March, June, August and November in 2025 - carries an extra helping of the busiest day and looks stronger than it really is. A weekly index removes that distortion entirely, because every week contains exactly one Sunday. What's left is the genuine shape of demand.
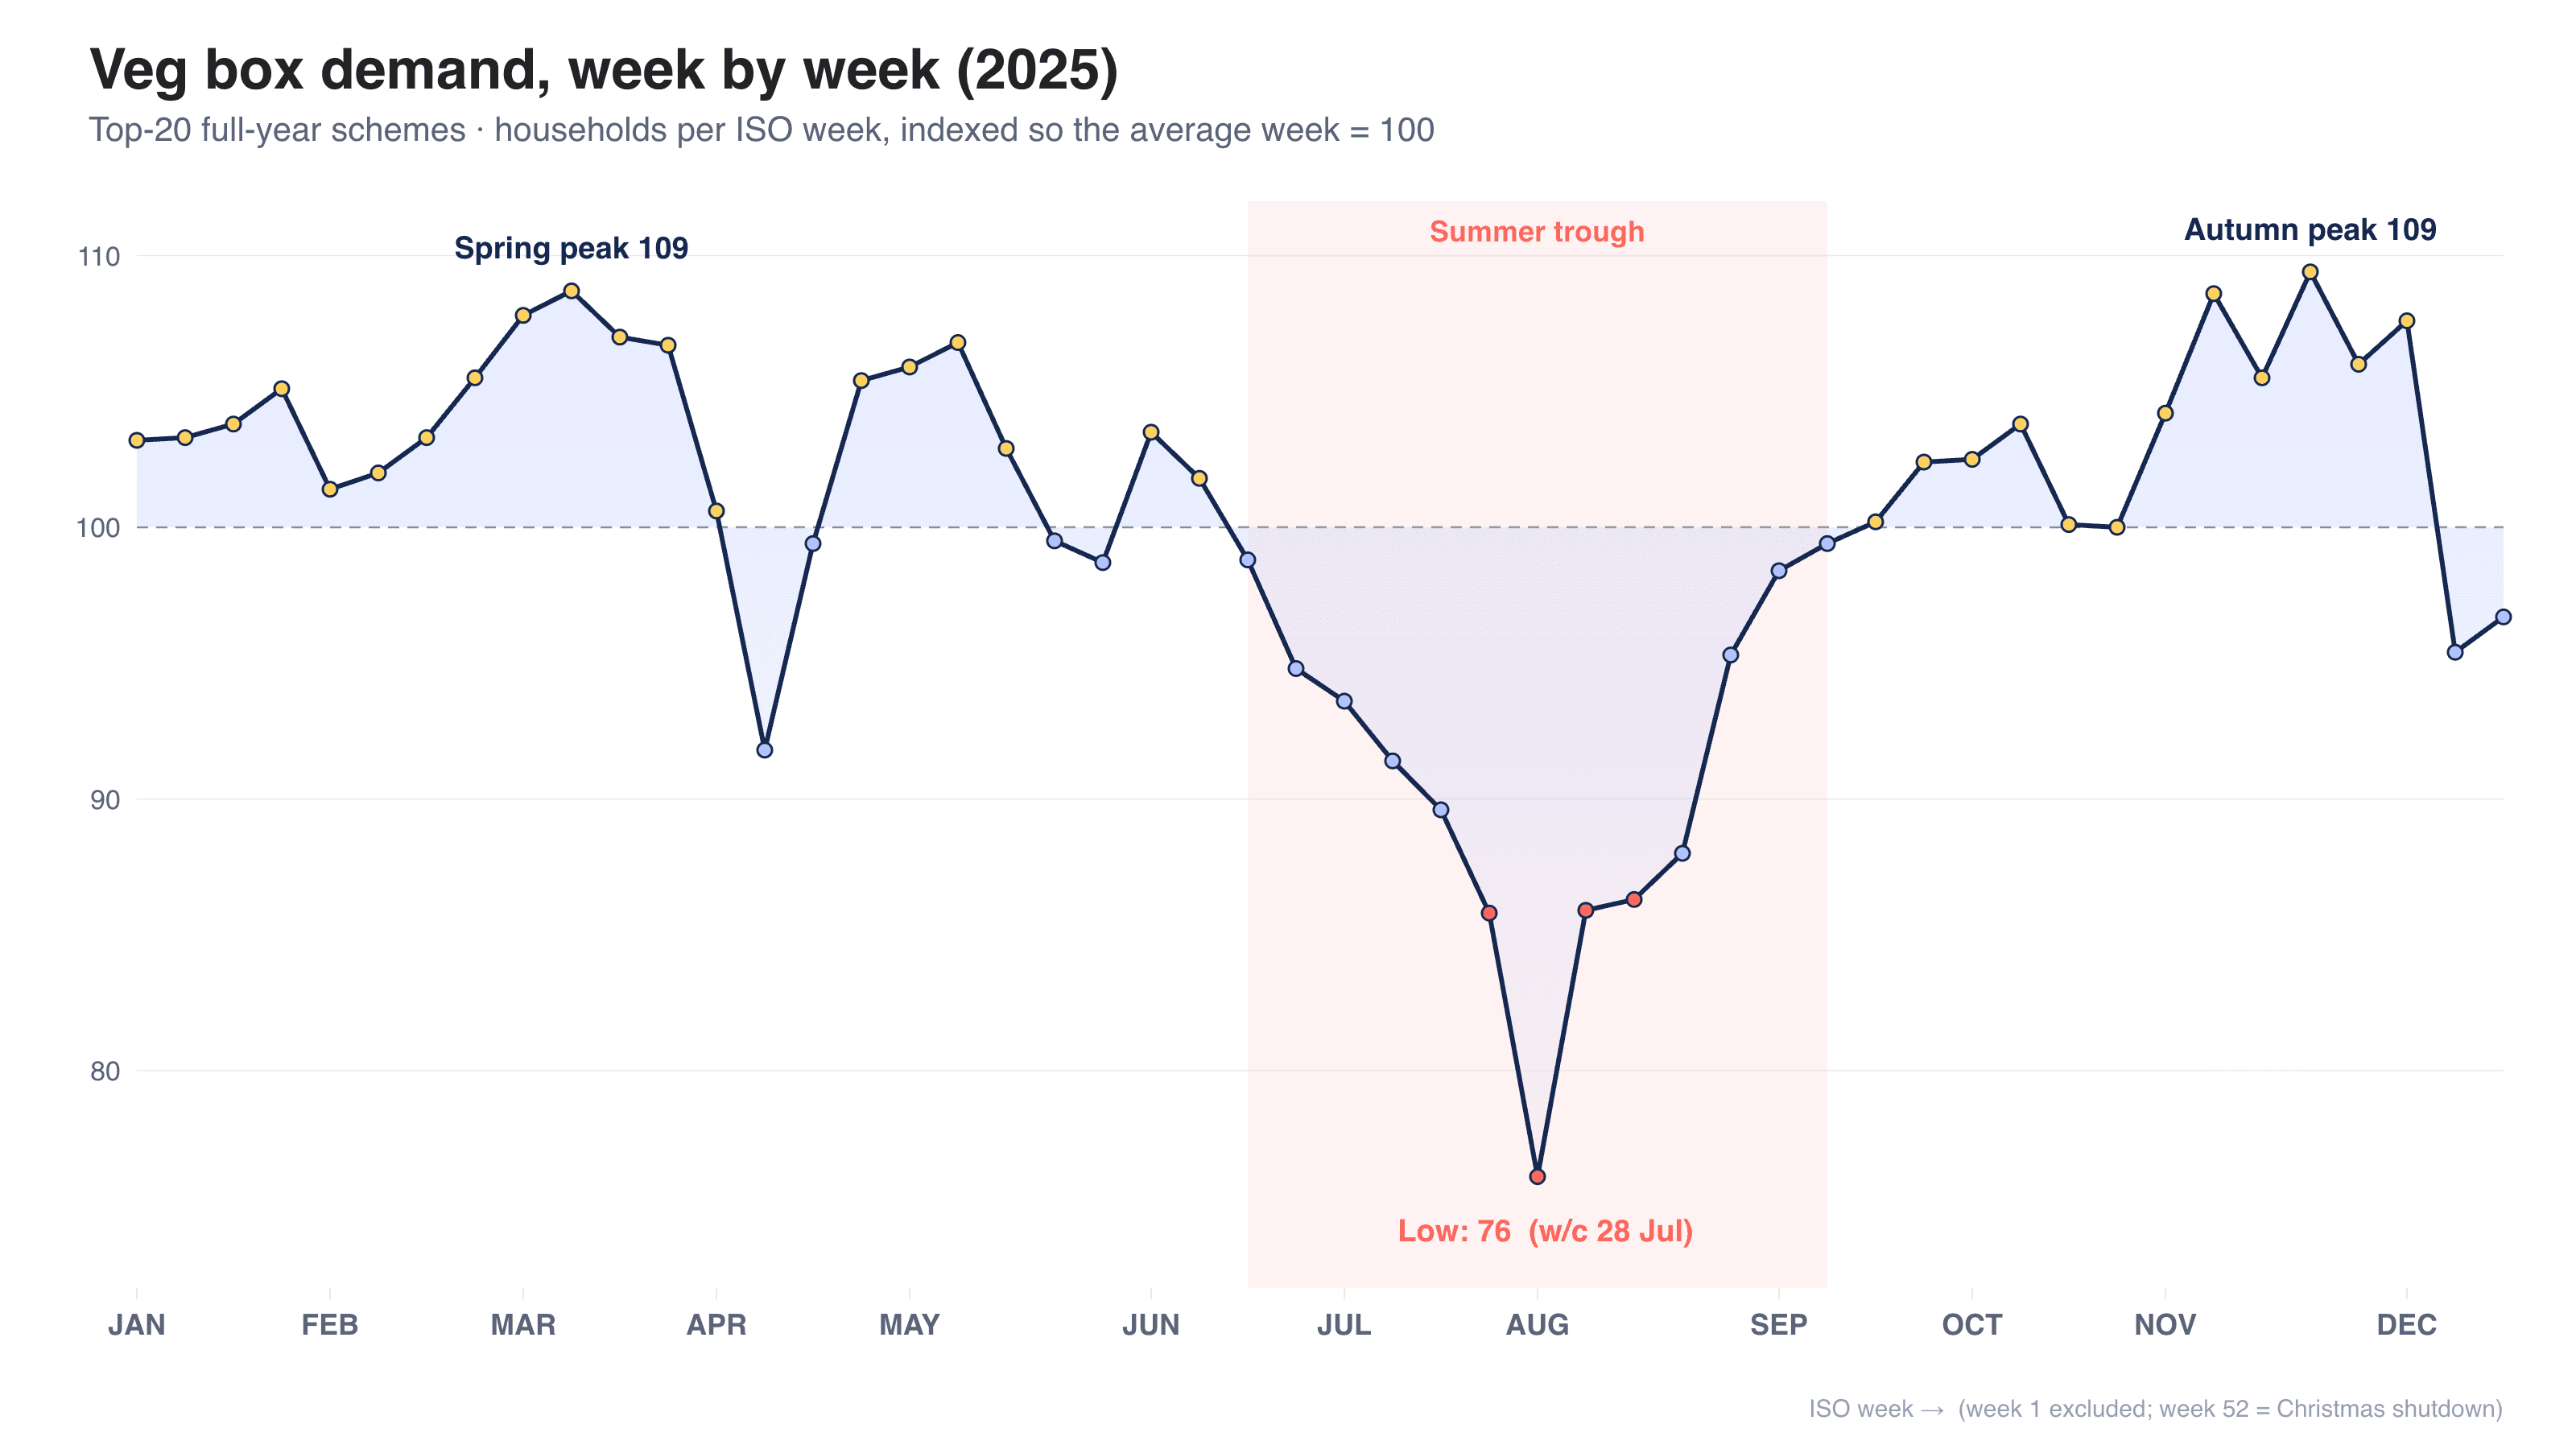
The shape, in numbers
Two peaks, one deep trough. The spring high runs across weeks 9-13 (early-to-mid March), topping out around index 109. The autumn high lands in mid-November (week 47) at index 109 - an almost identical peak. Between them is a sustained summer trough.
The trough is concentrated in late July and August. Demand falls below the 100 line from late June and bottoms out in the week commencing 28 July at index 76 - about 24% below a typical week, and the single quietest week of the year. The surrounding weeks (late July to mid-August) all sit in the mid-80s. This window aligns directly with the UK school summer holidays.
Peak to trough is roughly a 30% swing. From the spring high (109) to the late-July low (76), weekly household numbers fall by about a third.
Demand sits below average for around 13 weeks - roughly weeks 25 to 37, late June to mid-September - before crossing back above 100 around week 38 (mid-September). The recovery is steep: about 24 index points regained over seven weeks.
There is a second, sharper dip at Easter. Week 15 (early April) drops to index 92 in a single week, then rebounds immediately. It is brief but pronounced, and tracks the Easter holiday rather than a gradual seasonal move.
The pattern is near-universal. All 20 schemes in the sample dipped in summer. Individual summer dips ranged up to -29%, with a median near -11%. Variance can be caused by Scottish school holidays falling earlier in the season than in England and Wales.
Scheme size doesn't predict the dip. The ten largest schemes averaged a summer dip of about -13%; the ten smallest about -9%. The correlation between size and dip depth is weak (around -0.16). Being larger or smaller offers no meaningful protection.
Workload runs opposite to demand. The orders trough coincides with lots of sunshine and warm soils, lots of time on the land required, beds at full capacity. Labour requirement is high precisely when order volume is low.
A note on December. The final weeks split: schemes trading right up to Christmas run very busy (the late-December week is up more than 20% for those still operating), while others wind down early. December's reading depends heavily on how a scheme runs that final fortnight; week 52 is a near-total shutdown and is excluded from the baseline.
Caveats. This is a single year (2025), so it describes the shape of a typical year rather than a fixed rule. For schemes still in early growth, this seasonal pattern sits on top of an underlying upward trend, which can mask or sharpen the dip.
Summary
Two equal peaks (weeks 11 and 47, both ~109); deepest week w/c 28 July (index 76); peak-to-trough swing ~30%; ~13 weeks below average; back to normal by mid-September; dip present in 20 of 20 schemes; size-dip correlation negligible.
---
Method: Growing Good platform data, 2025. Completed and paid orders only, grouped by ISO week. Twenty full-year schemes, each indexed to its own average week (=100) before combining. Week 1 excluded (post-Christmas break); week 52 excluded from the baseline (Christmas shutdown).